Paid Acquisition
6 months
Winner Insulation wasn’t short on leads. They were short on answers. Their previous agency was reporting healthy conversions, but booked jobs weren’t keeping pace, cost per lead was north of $300, and nobody could explain why. Before we touched a single campaign, we asked a question their last agency never did: are we even measuring the right thing?
The Situation We Inherited
A dashboard full of green arrows, and a pipeline that didn’t match.
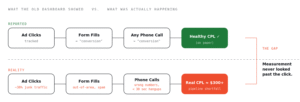
On paper, things looked fine. Form fills were coming in. Phone calls were ringing. Conversion rates were being reported. Underneath the dashboard, three things were broken at once — and no single fix would address any of them in isolation.
The previous agency had optimized the campaigns they were asked to run. What they hadn’t done — and what Winner Insulation didn’t know to ask for — was question whether the definitions of success were correct in the first place. A “conversion” was anything that triggered a tag. A “lead” was anyone who filled out a form or picked up the phone, regardless of whether they were a homeowner in the service area or a telemarketer calling about office supplies. Every number downstream of those definitions was, quietly, wrong.
Before engagement
Our Diagnosis
The problem wasn’t the media buying. It was the definition of a lead.
This is where most agency engagements don’t pause. The brief was “lower our cost per lead” — and a classic agency would have gone straight to bid strategies, ad copy tests, and new creative. We didn’t. We spent the first two weeks listening to phone calls, reading form submissions, and tracing individual leads through to the operations team.
The leads being counted weren’t the leads the business actually ran on. Roughly a third of tracked phone conversions were under 30 seconds — wrong numbers, hangups, robo-spam. Form fills were coming from outside the service radius. The dashboard was optimizing a definition of success that had no connection to whether a truck got dispatched.
Any agency can lower a cost per lead. The harder question — and the one worth paying for — is whether the thing you’re calling a lead is actually a lead.
— Our operating principle
That reframe changed everything downstream. If the measurement was wrong, no amount of campaign optimization would help — we’d just be making a broken system more efficient. So we made a call that cost us short-term win reporting but was the only honest way forward: tighten the definition of a lead, watch the numbers get worse before they got better, and rebuild optimization on top of a cleaner signal.
The Strategic Bet
From volume-based lead generation to quality-first acquisition.
The strategy wasn’t tactical. It was a shift in what we were optimizing for.
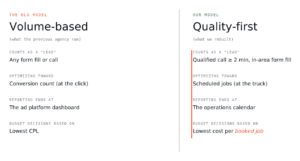
The model, before any tactics
How We Executed
Four pillars. Every tactic is a consequence of one of them.
The list of things a normal agency does — landing pages, call tracking, negative keywords — isn’t unique. What’s unique is why each one was done and how they were sequenced to reinforce a single thesis. Here’s how we grouped them.
Stop counting the wrong things.
Before optimization could mean anything, we had to fix what we were optimizing for. We deployed call tracking with full recording, set a 2-minute minimum for a call to count as a conversion, and manually listened to enough calls to build a qualification rubric. The effect: the conversion metric stopped lying.
- →Call tracking and call recording across all paid channels
- →Conversion threshold raised to qualified calls ≥ 2 minutes
- →Manual QA of form fills to filter out-of-area and spam submissions
Connect the click to the calendar.
A lead is only meaningful if you can follow it to a scheduled job. We built a centralized tracking system that let the operations team flag which leads actually booked, which channel they came from, and what service they wanted — then fed that signal back into campaign decisions every week.
- →Centralized lead-to-job tracking shared between marketing + ops
- →Weekly review cadence tying channel spend to booked revenue
- →Full-funnel visibility: click → call → qualified → quoted → booked
Every click lands somewhere it was promised.
Generic landing pages were dragging Quality Score down and telling searchers nothing specific. We built dedicated pages for each service, rewrote the value props around what actually differentiated Winner Insulation, and pruned search terms that weren’t going to turn into real jobs no matter what they cost.
- →Service-specific landing pages, one per offering
- →Differentiated value props replacing generic service copy
- →Ongoing negative keyword hygiene and search term review
Don’t let one channel decide the business.
With measurement fixed, we had the confidence to add a second acquisition channel without muddying the data. We introduced Facebook ads to reach demand outside of active search, held that traffic to the same qualification rubric, and gave Winner Insulation a hedge against platform-specific cost spikes.
- →Facebook as a second paid channel, held to the same quality bar
- →Creative tests anchored to the differentiated value props
- →Channel mix managed against booked jobs, not just CPL
The System We Built
From click to scheduled job, instrumented end-to-end.
This is the single most important artifact of the engagement — not a campaign, but a system. Every stage has a measurement point. Every measurement point feeds the next decision. Nothing stops at the ad platform.

The deliverable
Proof Of Work
What the inside of the engagement actually looks like.
Two of the most operational artifacts from this engagement. Most agencies show you decks. We’d rather show you the spreadsheet we live in every week and the line on the chart that matters.
Redacted excerpt

Illustrative, based on engagement data
What Changed
The numbers, and what they meant for the business.
A result without a business meaning is just a statistic. Here are the numbers, each paired with why it mattered to Winner Insulation specifically.
We came in thinking we had a cost problem. Digital Trax showed us we had a measurement problem — and fixing that fixed everything else.
— Winner Insulation leadership / placeholder, to confirm with client
Why This Engagement Is The Template
Most agencies optimize the campaign. We rebuild the system.
A classic agency would have taken the brief — “lower our CPL” — and run it. They’d have tested bid strategies, written new ad copy, maybe rebuilt a landing page. The numbers on the existing dashboard would have improved a little. The actual business problem — that the dashboard was lying — would have gone untouched.
What we did instead is what we do on every engagement: treat the brief as a hypothesis, not an instruction. Sometimes the brief is right and the work is execution. Often the brief is a symptom, and the real work is upstream of it. Knowing the difference is the entire job.
If you’re evaluating agencies and every pitch sounds the same, that’s because most of them are running the same playbook. The question worth asking isn’t what will you do? It’s how will you decide what to do?
